

Apache JMeter and I have a long and complicated relationship. It is definitely a trusted and valuable tool, but I am also quite confident that certain parts of it will make an appearance in my particular circle of hell. Due to this somewhat uncomfortable partnership, I am always interested in new tools for applying load to an infrastructure and monitoring the results. Locust.io is not exactly a new tool, but I have only recently begun to use it for testing.
What Is Locust?
Locust is a load-testing framework which allows you to write your load plan in regular Python. This is a welcome experience if you have ever had to manually edit a JMeter JMX file. Not only is it a more pleasant experience, but writing executors in Python makes it easy to create a very flexible load plan.
Idea For A Circle Of Hell: Given a slightly corrupted JMX file that must be loadable and cannot easily be replaced, attempt to look through it to find the error preventing loading. Every time you save the file, some other tag corrupts slightly. Who needs eternal damnation, give me a large JMX file and some failing drives…
The other advantage of Locust is that it has a quite nice flask-based UI (that you can extend fairly easily) and it is quite easy to distribute load generation among multiple locust instances or servers.
Simple Load Plan
In the grand tradition of blog entries like this, let's build a completely impractical, simplistic example.
from locust import HttpLocust, TaskSet, task

class test_user(TaskSet):
    @task
    def front_page(self):
        self.client.get("/")

    @task
    def about_page(self):
        self.client.get("/about/")

class TestUserRunner(HttpLocust):
    task_set = test_user
The above code imports the required pieces to build a Locust test plan, these being the TaskSet, HttpLocust instance, and the task decorator. The class you create by inheriting the TaskSet class represents a type of user for the most part (Anonymous, Authenticated, Editorial, etc). In reality it is just a set of individual tasks, supporting elements and supporting methods. However, that matches the reality of a user rather well, so in general I define separate task sets for different user types.
The majority of this code is fairly self-explanatory. You can make requests via the client.get call and individual tasks are marked with the ‘@task’ decorator. These tasks will be what the main testing routine executes and you can weight each task differently, if you choose to. For example, in the above code we might want to weight the front_page higher than the about_page, since the front page will likely see more traffic. You do this by passing the task decorator a weight (where a higher weight equals increased likelihood of running), like so:
@task(10)

def front_page(self):

    self.client.get("/")
Running Our Simple Load Plan
Executing our load plan is not difficult. We save the code to plan.py (or any other name that is NOT locust.py) and run:
locust -f plan.py --host=<our test target>
We then open a browser and go to localhost:8089. You will be prompted for the number of users to spawn and how many users to spawn per second. Once you fill this out you can start the test. You will see something like the following:
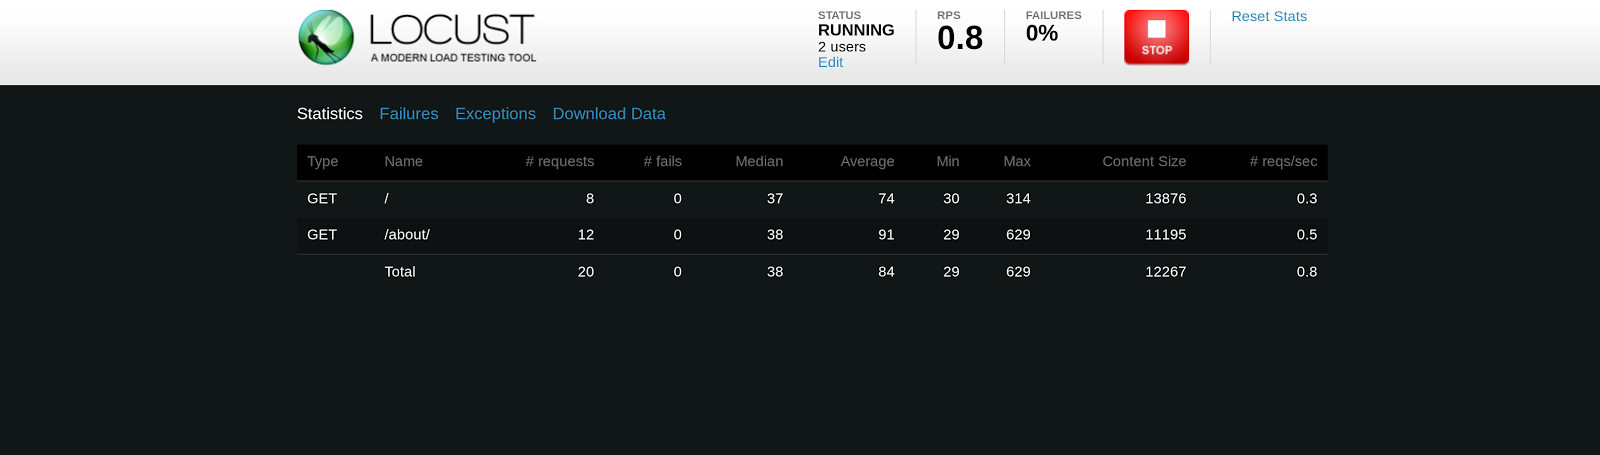
This screen will allow you to monitor your load test, download csv files containing results, stop the load test, and see failures. A quick note on ramp-up: You may notice that you get results up until the point where all of your requested users are launched, then the results are cleared. This is so your final results only include numbers from when all users were launched, but it can take you by surprise if you are not expecting it.
Fetching Static Assets
While the above example can test Drupal's ability to build and deliver a page, it doesn't do much to actually test the site or infrastructure. This is partly because we aren't fetching any static assets. This is where things get a bit interesting. In JMeter, you would check a box at this point. Locust on the other hand trusts you to handle this yourself. It has a very high opinion of you.
Fortunately, it isn’t that hard. There are a few different tools you can use to parse a returned page and pull out static resources. I am going to use BeautifulSoup because I find the name amusing.
NOTE: It is decisions like this that make me think I need to start planning for which circle of hell I end up in.
For my load tests I wrote a helper function called “fetch_static_assets”. The function is below:
def fetch_static_assets(session, response):
    resource_urls = set()
    soup = BeautifulSoup(response.text, "html.parser")

    for res in soup.find_all(src=True):
        url = res['src']
        if is_static_file(url):
            resource_urls.add(url)
        else:
            print "Skipping: " + url
The function is_static_file is quite important. The BeautifulSoup is going to return all URLs to you. Some of these may be broken, some may be off-site, etc. I recommend defining the is_static_file function and have it return false. Then look at what URLs are being skipped and slowly add patterns that match your static files and/or the URLs you want to fetch as sub-requests. In particular for a staging site, you don’t necessarily want to apply load to everything linked from your page. Here is an example of a very simplistic is_static_file function:
def is_static_file(f):
    if "/files" in f:
        return True
    else:
        return False
The rest of the fetch_static_assets function is below:
    for url in set(resource_urls):
        if "amazonaws.com" in url:
            session.client.get(url, name="S3 Static File")
            print "S3: " + url
        else:
            session.client.get(url, name="Static File")
            print "Regular: " + url
You can pass these static files into client.get for monitoring, but I would recommend setting the name to something consistent or else it is going to make your results quite messy. As you can see, I am tagging S3 URLs separately from regular static files in this example. Since you're defining all of this yourself, you have the flexibility to do basically whatever you want when you are parsing the page response and requesting sub-resources.
Below is an example of using this static asset function:
@task(10)
def frontpage(self):
    response = self.client.get("/")
    fetch_static_assets(self, response)
Logging Into Drupal
So, our load test can now fetch static assets. It can even fetch static assets of our choice and tag them as we would like. However, we are basically just testing the Drupal page cache at this point or perhaps Varnish or NGINX or even a CDN. Could be useful...probably isn’t though. To really be useful, we are going to have to login to the site. Fortunately this isn’t that difficult with Locust and we can use BeautifulSoup again. We are going to use the on_start method now. This is a special method of a Locust TaskSet that gets called on the start of the task set. It is not creatively named. Our example on_start is below:
def on_start(l):
    response = l.client.get("/user/login", name="Login")
    soup = BeautifulSoup(response.text, "html.parser")
    drupal_form_id = soup.select('input[name="form_build_id"]')[0]["value"]
    r = l.client.post("/user/login", {"name":"nnewton", "pass":"hunter2", "form_id":"user_login_form", "op":"Log+in", "form_build_id":drupal_form_id})
And there it is. Once this TaskSet logs in, Locust will keep the session cookie for the duration of that run. All requests from this TaskSet will be considered a logged in user. It is not uncommon for a test plan to have two TaskSets at the outside, one to cover the anonymous use-case and one for logged in users.
Locust is definitely a bit more difficult to approach than the JMeter GUI, but I have found it to be much easier to deal with when you are attempting to represent a somewhat complicated user pattern. In our next blog on this topic, we will be discussing how to use SaltStack and EC2 to automate Locust testing from multiple endpoints, i.e. spinning up a group of test VMs to run the Locust test plan and report back to a reporting node.
Download the demo load test described in this post.
Deploy Anywhere, Monitor Everything Drupal.
Take the headache out of Drupal security with Tag1 Quo - Drupal Monitoring Made Easy.