

Goose is the most scalable load testing tool available (10 - 20x faster than Locust), it uses much less hardware and is the easiest tool to scale. Check out the Goose source code, documentation, and all other Tag1 Goose related content!
Load testing is one of the tools we leverage regularly at Tag1. It can help prevent website outages, stress test code changes, and identify bottlenecks. The ability to run the same test repeatedly gives critical insight into the impact of changes to the code and/or systems. Often -- as part of our engagements with clients -- we will write a load test that can be leveraged and re-used by the client into the future.
In some cases, our clients have extensive infrastructures and multi-layered caches, including CDNs, that also need to be load tested. In these instances, it can take a considerable amount of computing power to generate sufficient load to apply stress and identify bottlenecks. This ultimately led us to write and open source Goose, a new and powerful load testing tool.
Locust Is Fantastic, Python Is Not Ideal
Discovering Locust was a breath of fresh air, solving so many of the frustrations we used to have when load testing with jMeter. Instead of working with a clunky UI to build sprawling, bloated JMX configuration files, Locust allows the writing of truly flexible test plans in pure Python. This allows code to easily be re-used between projects, and swarms of distributed Locusts can easily be spun-up to apply distributed load during testing. Locust added considerable power and flexibility to our load testing capabilities, and made the entire process more enjoyable.
Though Python is a great language that allows for quickly writing code, it's not without flaws. Locust uses resources more efficiently than jMeter, but the Python GIL, or Global Interpreter Lock, locks Python to a single CPU core. Fortunately, you can work around this limitation by starting a "slave process" for each core, and then performing the load test with a "master process" all running on the same server. Locust is therefore able to work around some of Python's limitations thanks to its excellent support for distributed load testing.
Recently we've been hearing a lot about the Rust language, and were curious to see if it could improve some of our standard toolset. The language has a steep learning curve primarily due to its concept of ownership, an ingenious solution to memory management that avoids the need for garbage collection. The language focuses on correctness, trading slower compilation times for extremely performant and reliable binaries. And there's a lot of (well earned) hype about how easy it is to write safe multithreaded code in Rust. It seemed like an excellent way to increase our ability to load test large client websites with fewer load testing server resources.
The Rust ecosystem is still fairly young and evolving, but there are already fantastic libraries providing much flexibility when load testing. The compiler ensures that you're writing safe code, and the resulting binaries tend to be really fast without extra programming effort. For these reasons, it was looking like Rust would be an excellent language to use for load testing.
Indeed, once we had an early prototype of Goose, we were able to run some comparisons, and have seen amazing performance improvements compared to similar load tests run with Locust. With the same test plan, Goose is consistently able to generate over five times as much traffic as Locust using the same CPU resources on the test server. As you add more CPU cores to the testing infrastructure, Goose's multithreaded Rust implementation seamlessly takes advantage of the added resources without additional configuration.
Goose Features
When writing Goose, we were primarily interested in preserving specific functionality from Locust that we use regularly. We first identified the run-time options we depend on the most, and then used the Rust structopt library to add them as command line options to the as-of-yet then non-functional Goose. We then worked option by option, studying how they are implemented in Locust and reimplementing them in Rust. The end result can be seen by passing the -h flag to one of the included examples.
CLI Options
The easiest way to develop Rust libraries and applications is with Cargo, the Rust package manager. Goose includes some example load tests to demonstrate how to write them, each of which can be run with Cargo. To compile and run the included simple example and pass the resulting application the -h flag, you can type:
$ cargo run --example simple --release -- -h
    Finished release [optimized] target(s) in 0.06s
     Running `target/release/examples/simple -h`
client 0.5.8
CLI options available when launching a Goose loadtest, provided by StructOpt

USAGE:
    simple [FLAGS] [OPTIONS]

FLAGS:
    -h, --help            Prints help information
    -l, --list            Shows list of all possible Goose tasks and exits
    -g, --log-level       Log level (-g, -gg, -ggg, etc.)
        --only-summary    Only prints summary stats
        --print-stats     Prints stats in the console
        --reset-stats     Resets statistics once hatching has been completed
        --status-codes    Includes status code counts in console stats
    -V, --version         Prints version information
    -v, --verbose         Debug level (-v, -vv, -vvv, etc.)

OPTIONS:
    -c, --clients           Number of concurrent Goose users (defaults to available CPUs)
    -r, --hatch-rate     How many users to spawn per second [default: 1]
    -H, --host                 Host to load test in the following format: http://10.21.32.33 [default: ]
        --log-file          [default: goose.log]
    -t, --run-time         Stop after the specified amount of time, e.g. (300s, 20m, 3h, 1h30m, etc.)
                                     [default: ]
Statistics
Goose displays the same statistics as Locust, though we chose to split the data into multiple tables in order to make the tool more useful from the command line. The following statistics were displayed after running a one-hour load test using the included drupal_loadtest example with the following options (which should look familiar to anyone that has experience running Locust from the command line):
cargo run --release --example drupal_loadtest -- --host=http://apache.fosciana -c 100 -r 10 -t 15m --print-stats --only-summary -v
The load test ran for fifteen minutes, then automatically exited after displaying the following statistics:
------------------------------------------------------------------------------
 Name                    | # reqs         | # fails        | req/s  | fail/s
 -----------------------------------------------------------------------------
 GET (Auth) comment form | 13,192         | 0 (0%)         | 14     | 0
 GET (Auth) node page    | 43,948         | 0 (0%)         | 48     | 0
 GET (Auth) login        | 20             | 0 (0%)         | 0      | 0
 GET (Anon) user page    | 268,256        | 0 (0%)         | 298    | 0
 GET static asset        | 8,443,480      | 0 (0%)         | 9,381  | 0
 GET (Auth) user page    | 13,185         | 0 (0%)         | 14     | 0
 GET (Anon) node page    | 894,176        | 0 (0%)         | 993    | 0
 POST (Auth) login       | 20             | 0 (0%)         | 0      | 0
 GET (Auth) front page   | 65,936         | 1 (0.0%)       | 73     | 0
 POST (Auth) comment f.. | 13,192         | 0 (0%)         | 14     | 0
 GET (Anon) front page   | 1,341,311      | 0 (0%)         | 1,490  | 0
 ------------------------+----------------+----------------+--------+---------
 Aggregated              | 11,096,716     | 1 (0.0%)       | 12,329 | 0
-------------------------------------------------------------------------------
 Name                    | Avg (ms)   | Min        | Max        | Median
 -----------------------------------------------------------------------------
 GET (Auth) comment form | 108        | 16         | 6271       | 100
 GET (Auth) node page    | 109        | 14         | 6339       | 100
 GET (Auth) login        | 23147      | 18388      | 27907      | 23000
 GET (Anon) user page    | 13         | 1          | 6220       | 4
 GET static asset        | 4          | 1          | 6127       | 3
 GET (Auth) user page    | 57         | 8          | 6205       | 50
 GET (Anon) node page    | 13         | 1          | 26478      | 4
 POST (Auth) login       | 181        | 98         | 234        | 200
 GET (Auth) front page   | 83         | 16         | 6262       | 70
 POST (Auth) comment f.. | 144        | 25         | 6294       | 100
 GET (Anon) front page   | 5          | 1          | 10031      | 3
 ------------------------+------------+------------+------------+-------------
 Aggregated              | 6          | 1          | 27907      | 3
-------------------------------------------------------------------------------
 Slowest page load within specified percentile of requests (in ms):
 ------------------------------------------------------------------------------
 Name                    | 50%    | 75%    | 98%    | 99%    | 99.9%  | 99.99%
 -----------------------------------------------------------------------------
 GET (Auth) comment form | 100    | 100    | 200    | 300    | 1000   |   1000
 GET (Auth) node page    | 100    | 100    | 200    | 300    | 1000   |   1000
 GET (Auth) login        | 23000  | 25000  | 27907  | 27907  | 27907  |  27907
 GET (Anon) user page    | 4      | 8      | 90     | 100    | 200    |    200
 GET static asset        | 3      | 6      | 10     | 10     | 30     |     30
 GET (Auth) user page    | 50     | 60     | 100    | 100    | 2000   |   2000
 GET (Anon) node page    | 4      | 7      | 200    | 200    | 300    |    300
 POST (Auth) login       | 200    | 200    | 200    | 200    | 200    |    200
 GET (Auth) front page   | 70     | 100    | 200    | 200    | 1000   |   1000
 POST (Auth) comment f.. | 100    | 200    | 300    | 300    | 400    |    400
 GET (Anon) front page   | 3      | 6      | 10     | 10     | 30     |     30
 ------------------------+--------+--------+--------+--------+--------+-------
 Aggregated              | 3      | 6      | 40     | 90     | 200    |   4000
Reviewing the above statistics, you can see there was a single error during the load test. Looking in the apache access_log, we find that it was a 500 error returned by the server when loading the front page as a logged in user:
127.0.0.1 - - [07/May/2020:01:26:34 -0400] "GET / HTTP/1.1" 500 4329 "-" "goose/0.5.8"
Goose introduces counts per-status-code, something not available in Locust. This can be enabled by specifying the --status-codes flag when running a load test, which provides more insight into what sorts of errors or other response codes the web server returned during the load test. During one round of testing, Goose generated the following warning:
06:41:12 [ WARN] "/node/1687": error sending request for url (http://apache.fosciana/node/1687): error trying to connect: dns error: failed to lookup address information: Name or service not known
In this particular case, no request was made as a DNS lookup failed, and so there was no status code returned by the server. Goose assigns client failures such as the above a status code of 0, which shows up in the status code table as follows:
-------------------------------------------------------------------------------
 Name                    | Status codes
 -----------------------------------------------------------------------------
 GET static asset        | 125,282 [200]
 GET (Auth) comment form | 1,369 [200]
 GET (Anon) user page    | 11,139 [200]
 GET (Anon) front page   | 55,787 [200]
 POST (Auth) login       | 48 [200]
 GET (Auth) node page    | 4,563 [200]
 GET (Auth) front page   | 6,854 [200]
 GET (Anon) node page    | 37,091 [200], 1 [0]
 GET (Auth) login        | 48 [200]
 POST (Auth) comment f.. | 1,369 [200]
 GET (Auth) user page    | 1,364 [200]
-------------------------------------------------------------------------------
 Aggregated              | 244,914 [200], 1 [0]
As with all other statistics tables, Goose breaks things out per request, as well as giving an aggregated summary of all requests added together.
Weights
Load tests are collections of one or more task sets, each containing one or more tasks. Each "client" runs in its own thread and is assigned a task set, repeatedly running all contained tasks. You can better simulate real users or your desired load patterns through weighting, causing individual tasks to run more or less frequently, and individual task sets to be assigned to more or fewer client threads.
When using Locust we’ve frequently found its heuristic style of assigning weights frustrating, as large weights mixed with small weights within a task set can lead to individual tasks never running. Goose is intentionally very precise when applying weights. If a task set has two tasks -- for example, task "a" with a weight of 1 and task "b" with a weight of 99 -- it will consistently run task "a" one time, and task "b" ninety nine times each and every time it loops through the task set. The order of tasks, however, are randomly shuffled each time the client thread loops through the task set.
Sequences
A client is assigned one task set, and by default will run all contained tasks in a random order, shuffling the order each time it completes the running of all tasks. In some cases, it can be desirable to better control the order client threads run tasks. Goose allows you to optionally assign a sequence (any integer value) to one or more tasks in a task set, controlling the order in which client threads run the tasks. Tasks can be both weighted and sequenced at the same time, and any tasks with the same sequence value will be run in a random order, before any tasks with a higher sequence value. If a task set mixes sequenced tasks and unsequenced tasks, the sequenced tasks will always all run before the unsequenced tasks.
On Start
Tasks can also be flagged to only run when a client thread first starts. For example, if a task set is intended to simulate a logged in user, you likely want the user to log in only one time when the client thread first starts. For maximum flexibility, these tasks can also be sequenced and weighted if you want the tasks to run more than once, or multiple tasks to run in a specific order only when the client first starts.
On Stop
Similarly, Goose also allows tasks to be flagged to only run when a client thread is stopping. For example, you can have a client thread simulate logging out at the end of the load test. Goose client threads will only execute these tasks when a load test reaches the configured run time, or is canceled with control-c. As expected, these tasks can also be sequenced and weighted. You can also flag any task to run both at start time and at stop time.
Wait Time
If no wait time is assigned to a task set, any client threads running that set will execute tasks one after the other as rapidly as they can. This can generate large amounts of load, but it can also result in generating unrealistic loads, or it can bottleneck the load testing server itself. Typically you'd specify a wait time, which tells Goose client threads how long to pause after executing each task. Wait time is declared with a low-high integer tuple, and the actual time paused after each task is a randomly selected value from this range.
Clients
Rust has no global lock and thus is able to make far better use of available CPU cores than Python. By default Goose will spin up 1 client per core, each running in its own thread. You can use the --clients option to control how many total clients are launched, and the --hatch-rate option to control how quickly they are launched by specifying how many to launch per second. When you build more complex test plans and start launching thousands of concurrent clients, you’ll likely need to increase kernel level limits on the maximum number of open files. You'll also need to add some delays to the task set, by specifying a wait time as described above.
Run Time
If you don't specify a run time, Goose will generate load until you manually stop it. If you've enabled the display of statistics, they will be displayed as soon as you cancel the load test with control-c.
Naming Tasks
When using Goose's built in statistics, by default each request is recorded and identified by the URL requested. As load tests get more complex, this can result in less useful statistics. For example, when load testing the Drupal Memcache module, one of our tasks loads a random node, and this can generate up to 10,000 unique URLs. In this case, the Drupal-powered website follows the same code path to serve up any node, so we prefer that the statistics for loading nodes are all grouped together, instead of being broken out per node id.
This can be achieved by applying custom names at the task level, which causes all requests made within that task to be grouped together when displaying statistics. Names can also be specified at the request level, giving total flexibility over how statistics are grouped and identified. Naming tasks and requests is only relevant when displaying statistics.
Requests
The primary use-case of Goose is generating HTTP(S) requests. Each client thread initializes a Reqwest blocking client when it starts, and then this client is used for all subsequent requests made by that individual thread. And no, that's not a typo, the Rust library we're using is spelled "Reqwest". The Reqwest client automatically stores cookies, handles headers, and much more, simplifying the task of writing load test tasks. All available Reqwest functions can be called directly, but it's important to use the provided Goose helpers if you want accurate statistics, and if you want to be able to easily change the host the load test is applied against with a run-time flag.
Goose provides very simplistic GET, POST, HEAD and DELETE wrappers, simplifying the most common request types. There are also two-part helpers allowing raw access to the underlying Reqwest objects allowing more complex GET, POST, HEAD, DELETE, PUT and PATCH requests.
By default, Goose will check the status code returned by the server, identifying 2xx codes as successes, and non-2xx codes as failures. It allows you to override this within your task if necessary, for example if you want to write a task that tests 404 pages and therefore considers a 404 status code as a success, and anything else including 2xx status codes as a failure. It can also be useful to review response bodies or headers and verify expected text or tags are where you expect them, flagging the response as a failure if not.
Load Testing With Goose
Our first proof of concept for Goose was to load test a new version of the Drupal Memcache module. Years ago we started load testing each release with jMeter, an effective way to validate changes in the low-level code that's trusted to help the performance of tens of thousands of Drupal websites. A few years ago these tests were rewritten in Python, as Locust had become our favored load testing tool at Tag1. Thus, rewriting the tests again in Rust for Goose seemed like an excellent place to start testing Goose, and offered a chance to make some early comparisons between the tools.
8-core Test System Running Against a 16-core Web Server
All of our current testing is being done on a single system with a 32-core AMD Threadripper, managed with Proxmox. We set up two VMs running Debian 10 during initial development, with a 16-core VM running Apache, PHP, and MySQL, and an 8-core VM running Goose. All server processes are restarted between tests, and the database is reloaded from a backup.
Once Goose supported all functionality required by the Drupal Memcache loadtest, it was a good time to run some comparisons to better understand if we are indeed benefitting by using Rust. To begin, we simply used the existing load testing VMs already set up for development. Of course, you generally wouldn't have (or want to need) so many cores dedicated to the load testing tool compared to the web server.
Goose
Our old test plans "simulated" 100 users pounding the web pages as fast as possible (without any wait time), so we started with the same configuration for Goose. This is not a very realistic test, as real users would generally pause on each page, but we wanted to change as few variables as necessary when getting started. And the primary intent of this load test is to put some stress on the Drupal memcache module's code.
We launched the first Goose load test as follows:
cargo run --release --example drupal_loadtest -- --host=http://apache.fosciana -c 100 -r 10 -t 1h --print-stats --only-summary -v
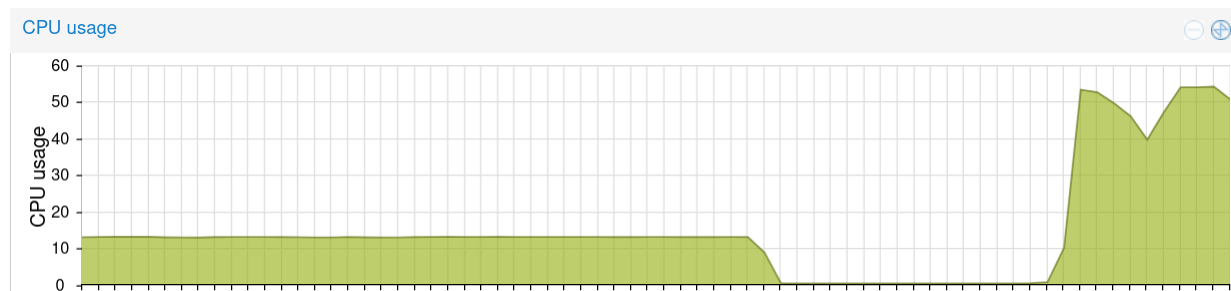
It was initially surprising that this didn't put much strain on the load testing VM, taking only about 40% of the available CPU resources. This was surprising as Goose creates a new thread for each client, and Rust has no global lock, so it should have been using all 8 cores fully available to it, yet clearly wasn't using them:
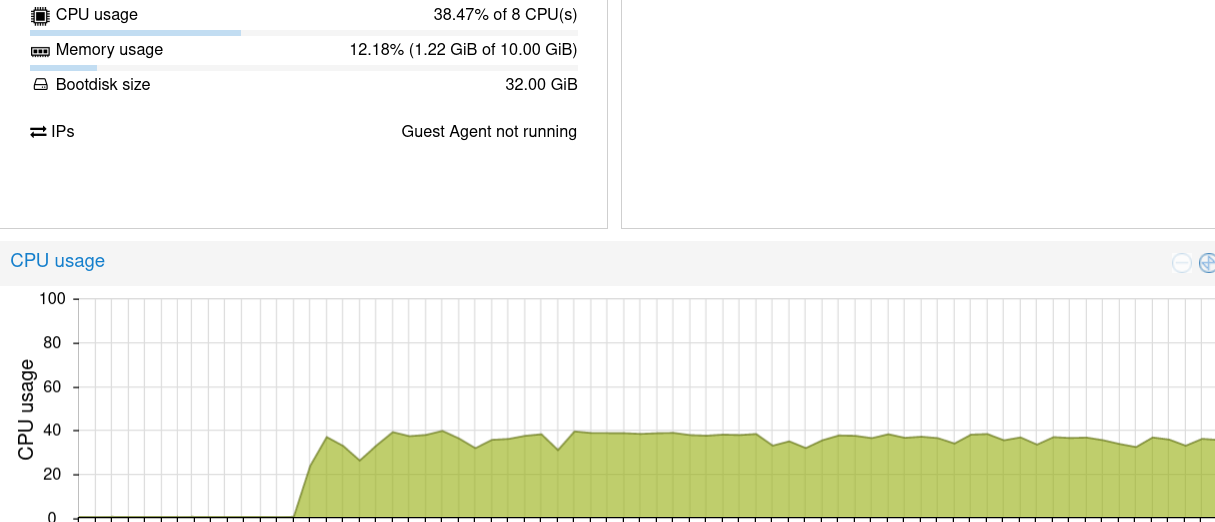
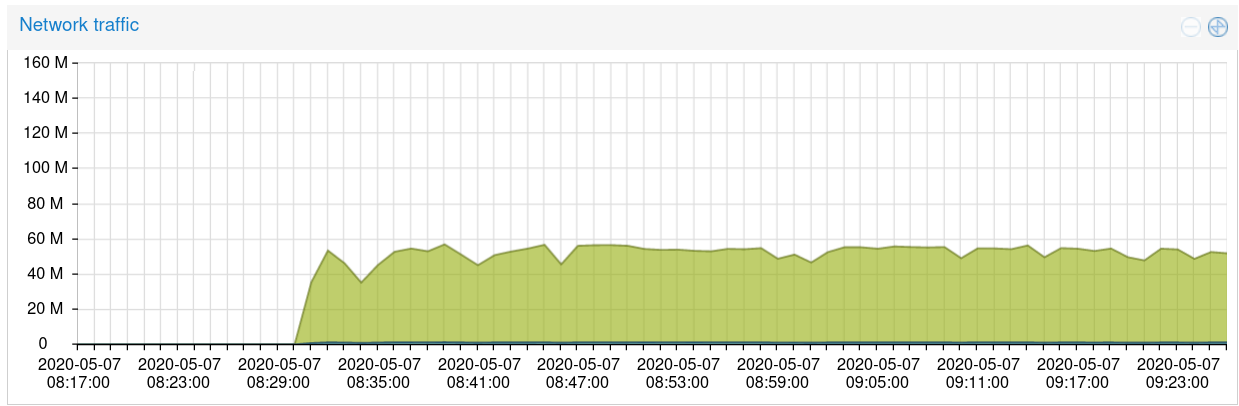
During this test, it generated nearly 60 Mbit/second of traffic for the duration of the test:
Further analysis revealed that the shared web and database server was the bottleneck. Specifically, several of the Goose task sets were logging in and posting comments so quickly that Drupal's caches were flushing 10 times a second, causing the MySQL database to bottleneck and slow everything down. This resulted in all the clients being blocked, waiting for the web page to return results.
The following are the Goose statistics output after one such load test run:
------------------------------------------------------------------------------
 Name                    | # reqs         | # fails        | req/s  | fail/s
 -----------------------------------------------------------------------------
 GET (Anon) user page    | 475,275        | 0 (0%)         | 132    | 0
 POST (Auth) login       | 20             | 0 (0%)         | 0      | 0
 GET (Auth) comment form | 37,295         | 0 (0%)         | 10     | 0
 GET (Anon) front page   | 2,376,330      | 1 (0.0%)       | 660    | 0
 GET (Auth) node page    | 124,327        | 0 (0%)         | 34     | 0
 GET (Auth) login        | 20             | 0 (0%)         | 0      | 0
 GET static asset        | 5,125,594      | 0 (0%)         | 1,423  | 0
 GET (Auth) user page    | 37,293         | 0 (0%)         | 10     | 0
 GET (Auth) front page   | 186,468        | 0 (0%)         | 51     | 0
 POST (Auth) comment f.. | 37,295         | 0 (0%)         | 10     | 0
 GET (Anon) node page    | 1,584,250      | 0 (0%)         | 440    | 0
 ------------------------+----------------+----------------+--------+---------
 Aggregated              | 9,984,167      | 1 (0.0%)       | 2,773  | 0
-------------------------------------------------------------------------------
 Name                    | Avg (ms)   | Min        | Max        | Median
 -----------------------------------------------------------------------------
 GET (Anon) user page    | 75         | 1          | 6129       | 80
 POST (Auth) login       | 149        | 68         | 309        | 100
 GET (Auth) comment form | 189        | 23         | 6204       | 200
 GET (Anon) front page   | 11         | 1          | 6043       | 7
 GET (Auth) node page    | 190        | 17         | 6267       | 200
 GET (Auth) login        | 49         | 3          | 140        | 40
 GET static asset        | 2          | 1          | 100        | 1
 GET (Auth) user page    | 93         | 7          | 6082       | 80
 GET (Auth) front page   | 121        | 14         | 6115       | 100
 POST (Auth) comment f.. | 281        | 40         | 1987       | 300
 GET (Anon) node page    | 127        | 1          | 6280       | 100
 ------------------------+------------+------------+------------+-------------
 Aggregated              | 34         | 1          | 6280       | 4
-------------------------------------------------------------------------------
 Slowest page load within specified percentile of requests (in ms):
 ------------------------------------------------------------------------------
 Name                    | 50%    | 75%    | 98%    | 99%    | 99.9%  | 99.99%
 -----------------------------------------------------------------------------
 GET (Anon) user page    | 80     | 100    | 200    | 200    | 300    |    300
 POST (Auth) login       | 100    | 200    | 300    | 300    | 300    |    300
 GET (Auth) comment form | 200    | 200    | 300    | 400    | 900    |    900
 GET (Anon) front page   | 7      | 10     | 30     | 40     | 100    |    100
 GET (Auth) node page    | 200    | 200    | 300    | 400    | 6000   |   6000
 GET (Auth) login        | 40     | 80     | 100    | 100    | 100    |    100
 GET static asset        | 1      | 2      | 10     | 20     | 30     |     30
 GET (Auth) user page    | 80     | 100    | 200    | 200    | 5000   |   5000
 GET (Auth) front page   | 100    | 100    | 200    | 200    | 6000   |   6000
 POST (Auth) comment f.. | 300    | 300    | 500    | 500    | 700    |    700
 GET (Anon) node page    | 100    | 200    | 400    | 400    | 500    |    500
 ------------------------+--------+--------+--------+--------+--------+-------
 Aggregated              | 4      | 10     | 300    | 300    | 400    |   6000
The single failure above was a time out, for which Goose displayed the following easy to understand error:
failed to parse front page: error decoding response body: operation timed out
Locust
We then configured Locust to generate the same load from the same 8-core VM. Python's Global Interpreter Lock quickly made an appearance, limiting how much traffic a single instance of Locust can generate.
The load test was launched with the following options:
locust -f locust_testplan.py --host=http://apache.fosciana --no-web -c 100 -r 10 -t 1h --only-summary
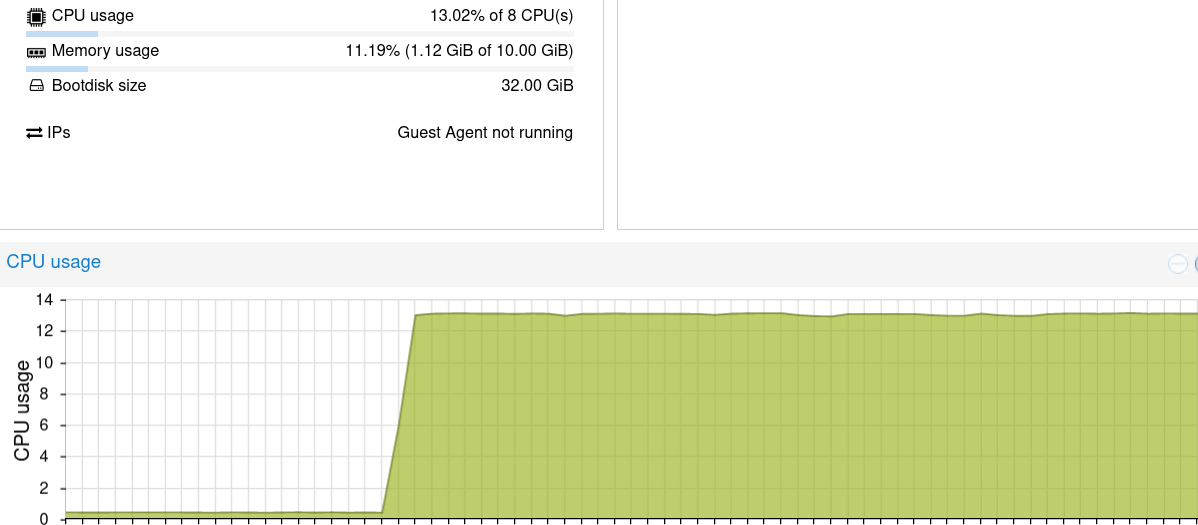
Locust saturated a single core of the 8-core VM:
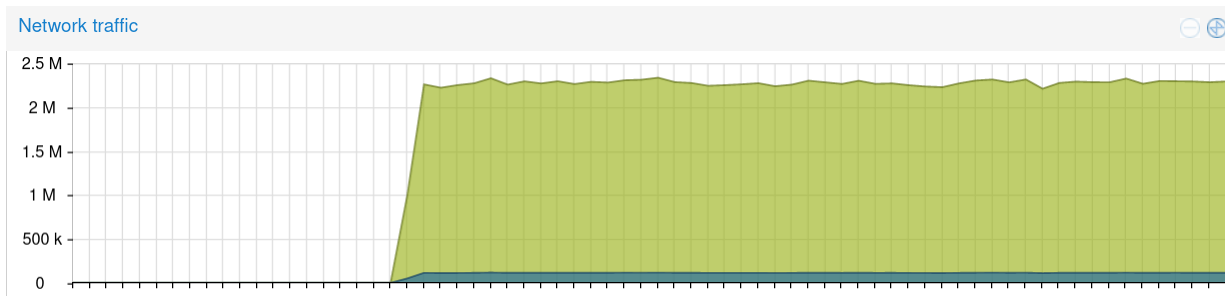
It also generated considerably less traffic, around 2.3 Mbit/second compared to the 58 Mbit/second generated by Goose:
The following are the complete Locust statistics output after one such load test run:
 Name                                                          # reqs      # fails     Avg     Min     Max  |  Median   req/s failures/s
--------------------------------------------------------------------------------------------------------------------------------------------
 GET (Anonymous) /node/[nid]                                    74860     0(0.00%)     296      21   11697  |     270   20.74    0.00
 GET (Anonymous) /user/[uid]                                    22739     5(0.02%)     297      14    8352  |     270    6.30    0.00
 GET (Anonymous) Front page                                    112904     0(0.00%)     312       4   12564  |     290   31.28    0.00
 GET (Auth) /node/[nid]                                         17768     0(0.00%)     296      24   10540  |     270    4.92    0.00
 GET (Auth) /user/[uid]                                          5200     1(0.02%)     293      15    6120  |     270    1.44    0.00
 GET (Auth) Comment form                                         5306     0(0.00%)     293      18    2330  |     270    1.47    0.00
 GET (Auth) Front page                                          26405     0(0.00%)     289      20   10137  |     260    7.32    0.00
 POST (Auth) Logging in: /user                                     20     0(0.00%)     370     105     706  |     350    0.01    0.00
 GET (Auth) Login                                                  20     0(0.00%)    2600     909    5889  |    2200    0.01    0.00
 POST (Auth) Posting comment                                     5306     0(0.00%)     448      34    5147  |     440    1.47    0.00
 GET (Static File)                                             835603     0(0.00%)     293       4   11965  |     270  231.51    0.00
--------------------------------------------------------------------------------------------------------------------------------------------
 Aggregated                                                   1106131     6(0.00%)     296       4   12564  |     270  306.46    0.00
Percentage of the requests completed within given times
Type                 Name                                                           # reqs    50%    66%    75%    80%    90%    95%    98%    99%  99.9% 99.99%   100%
GET                  (Anonymous) /node/[nid]                                         74860    270    330    370    390    440    480    530    570    810   5100  12000
GET                  (Anonymous) /user/[uid]                                         22739    270    330    370    390    440    480    530    570    800   4800   8400
GET                  (Anonymous) Front page                                         112904    290    350    390    410    450    490    530    560    790   5800  13000
GET                  (Auth) /node/[nid]                                              17768    270    330    370    390    440    480    530    580    770   6600  11000
GET                  (Auth) /user/[uid]                                               5200    270    330    370    390    440    480    540    580    840   6100   6100
GET                  (Auth) Comment form                                              5306    270    330    370    390    440    480    530    580    750   2300   2300
GET                  (Auth) Front page                                               26405    260    320    370    390    430    470    520    560    800   3600  10000
POST                 (Auth) Logging in: /user                                           20    360    410    460    530    610    710    710    710    710    710    710
GET                  (Auth) Login                                                       20   2400   3200   4000   4000   4400   5900   5900   5900   5900   5900   5900
POST                 (Auth) Posting comment                                           5306    440    550    620    650    710    760    840    890   1200   5100   5100
GET                  (Static File)                                                  835603    270    330    370    390    440    480    520    560    780   5200  12000
None                 Aggregated                                                    1106131    270    330    380    400    440    480    530    570    800   5400  13000
Error report
occurrences      Error

5                  GET (Anonymous) /user/[uid]: "HTTPError('404 Client Error: Not Found for url: (Anonymous) /user/[uid]')"
1                  GET (Auth) /user/[uid]: "HTTPError('404 Client Error: Not Found for url: (Auth) /user/[uid]')"
Distributed Locust
Fortunately, Locust has fantastic support for running distributed tests, and this functionality can also be utilized to generate more load from a multi-core server.
We first started the master Locust process as follows:
locust -f locust_testplan.py --host=http://apache.fosciana --no-web -t 1h -c100 -r10 --only-summary --master --expect-slaves=8
We then launched eight more instances of Locust running in slave-mode, starting each one as follows:
locust -f locust_testplan.py --host=http://apache.fosciana --no-web --only-summary --slave
The end result was eight individual Python instances all working in a coordinated fashion to generate load using all available CPU cores. The increased load is visible in the following CPU graph, where the load from a single Locust instance can be seen on the left, and the load from one master and eight slaves can be seen on the right:
Perhaps more importantly, this resulted in considerably more network traffic, as desired:
With both distributed Locust and standard Goose, we are using all available CPU cores, but our requests are being throttled by bottlenecks on the combined web and database server. In this distributed configuration, Locust was able to sustain a little over half the network load as Goose.
1-core Testing System Running Against a 16-core Web Server with Varnish
From here we made a number of configuration changes, running new load tests after each change to profile the impact. Ultimately we ended up on a single-core VM for running the load tests, against a 16-core VM for running the LAMP stack. We also added Varnish to cache anonymous pages and static assets in memory, offloading these requests from the database.
We tuned the database for the most obvious gains, giving InnoDB more memory, disabling full ACID support to minimize flushing to disk, and turning off the query cache to avoid the global lock. We also conifgured Drupal to cache anyomous pages for a minimum of 1 minute. Our goal was to remove the server-side bottlenecks to better understand our load testing potential.
    [mysqld]
    innodb_buffer_pool_size = 1G
    innodb_flush_log_at_trx_commit = 0
    query_cache_size = 0
These combined changes removed the most extreme server-side bottlenecks.
Measuring Goose Performance on a Single Core VM
With the web server able to sustain more simulated traffic, we launched another Goose load test in order to see how much traffic Goose could generate from a single-CPU system. With a little trial and error, we determined that 12 clients loading pages as fast as they could produced the optimal load from a 1-core VM, initiating the test with the following options:
cargo run --release --example drupal_loadtest -- --host=http://apache.fosciana -c 12 -r 2 -t1h --print-stats --only-summary -v
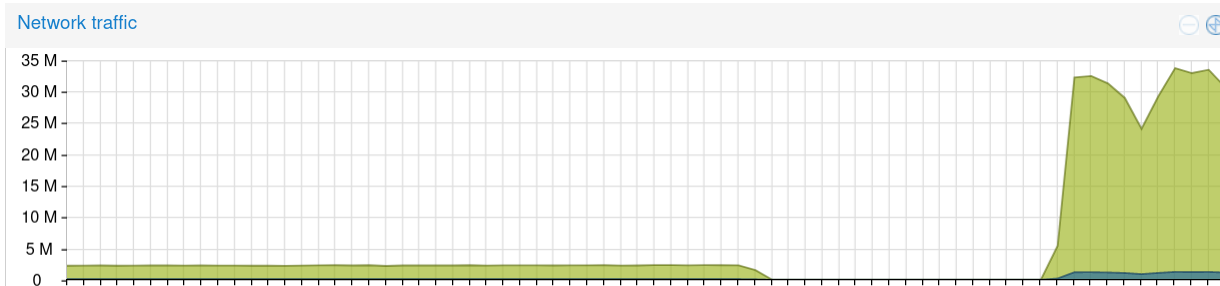
Goose was now bottlenecked only by running from a single CPU core, fairly consistently consuming 100% of its CPU resources:
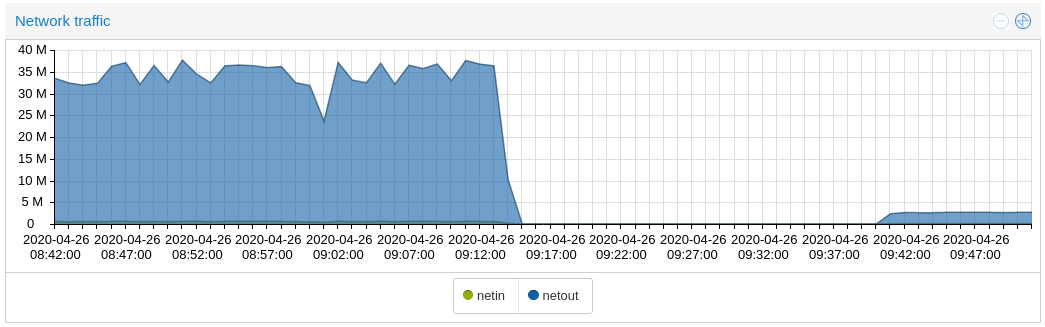
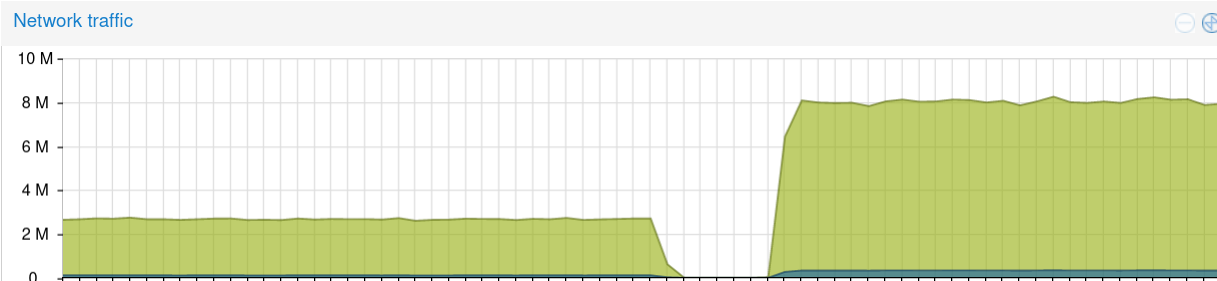
And perhaps more importantly, Goose was able to generate 35Mbit/second of network traffic, all from a single process running on a single-core VM:
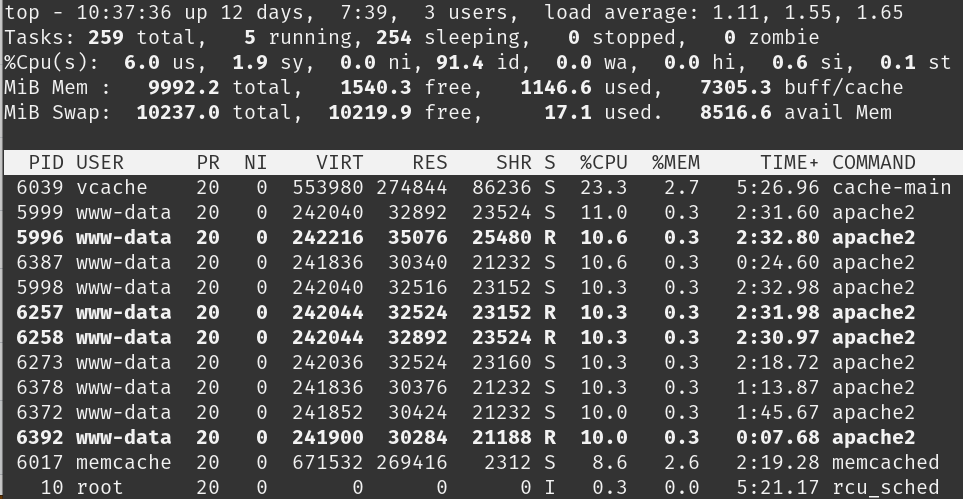
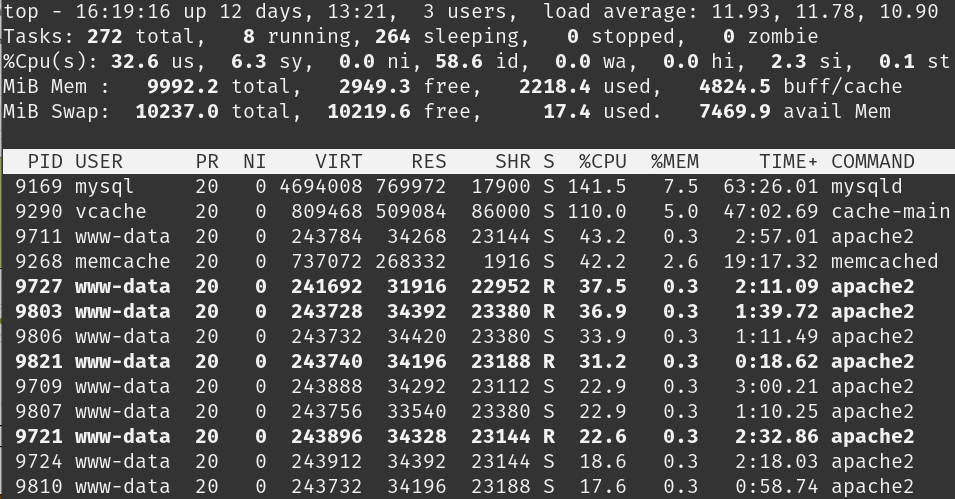
Using top to look at the server load, you can see that MySQL, Varnish, Memcached and Apache are all getting a healthy workout:
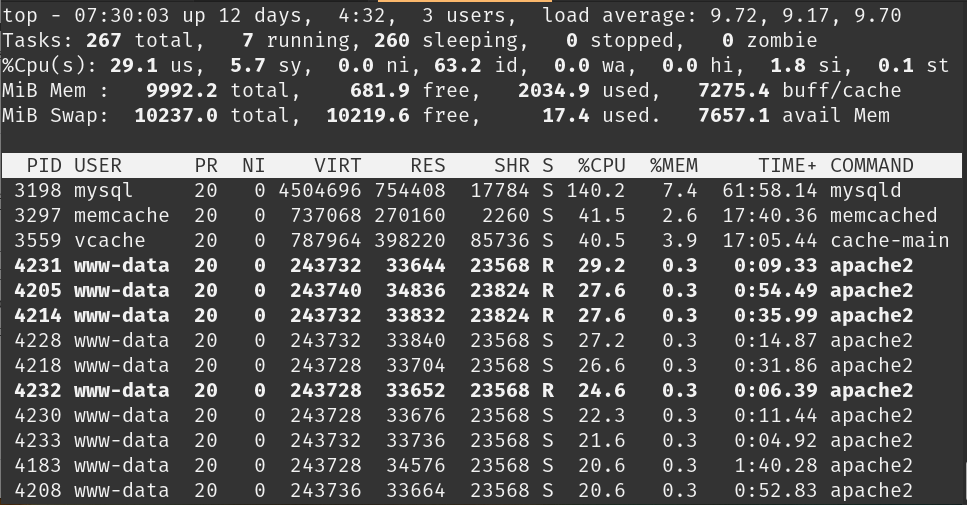
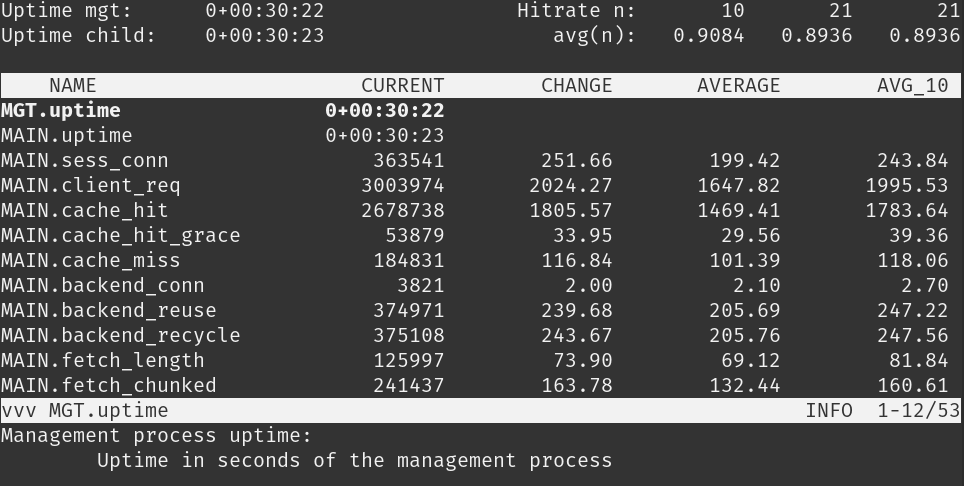
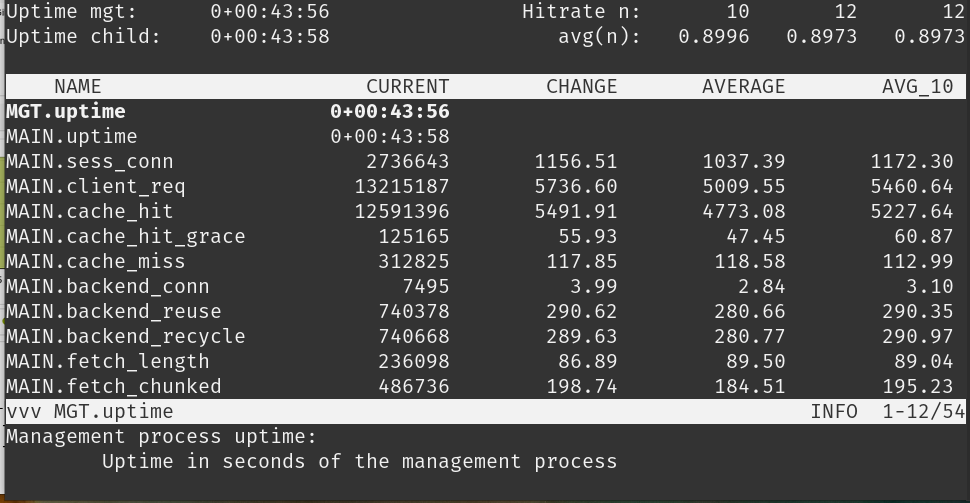
And with varnishstat we can get some insight into where Varnish is spending its time. It's successfully serving most requests out of memory:
Measuring Locust Performance on a Single Core VM
From the same single-core VM, we also ran the equivalent load test with Locust. We started it with similar command line options:
locust -f locust_testplan.py --host=http://apache.fosciana --no-web -t 1h -c12 -r2 --only-summary
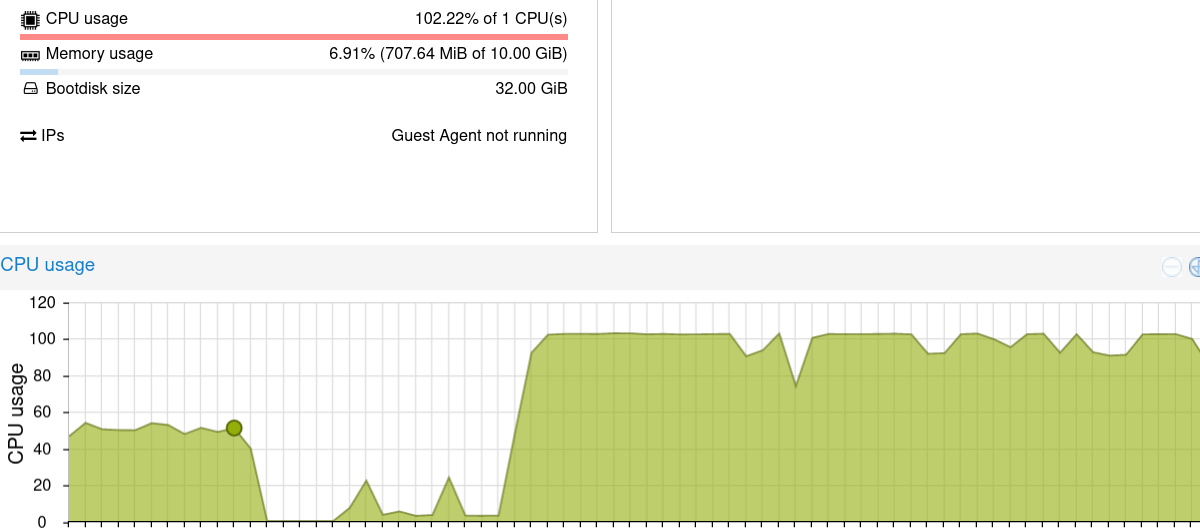
As seen below, Locust again pegs the single CPU at 100%. In fact, it's much more consistent about doing this than Goose is -- an apparent bug in Goose (see the dips and valleys on the left side of the chart below) -- something that still needs to be profiled and fixed:
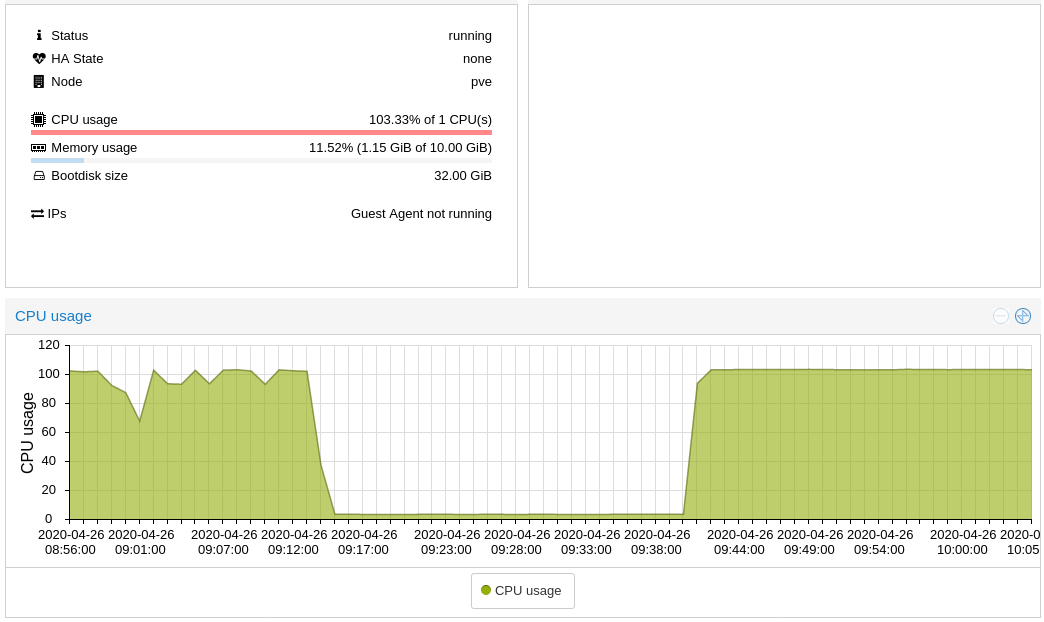
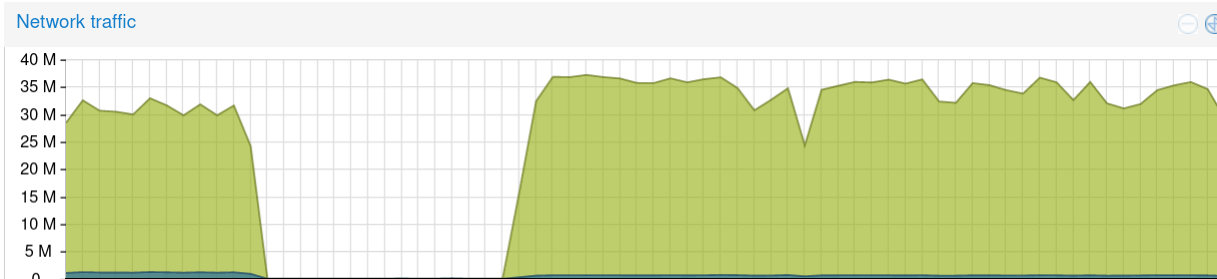
However, while Locust produces steady load, it's only generating about 3Mbit/second of traffic versus Goose's 35Mbit/second. Now that there's no server bottleneck, Goose's true potential and advantages are far more visible. The following graph shows network traffic generated by Goose on the left side of the graph, and Locust on the right side. In both instances they are utilizing 100% CPU on the load test VM:
Speeding Up Locust through Optimization
We've used Locust enough to know it can generate significantly more load than this. Through profiling, we identified that the botteleneck was due to using Beautiful Soup to extract links from the pages. Parsing the HTML is really expensive! To solve, we replaced the Beautiful Soup logic with a simple regular expression.
The load testing client continued to use 100% of the available CPU, but network traffic grew nearly four times, to 8 Mbit/second:
This was definitely a big step in the right direction! But the question remained, could we generate even more load from a single core?
Speeding Up Locust with FastHttpLocust
Locust includes an alternative HTTP client, called FastHttp, which the documentation suggests can increase Locust's performance. We updated our test plan, switching from HttpLocust to FastHttpLocust. The defined tasks are simple enough no other changes were necessary.
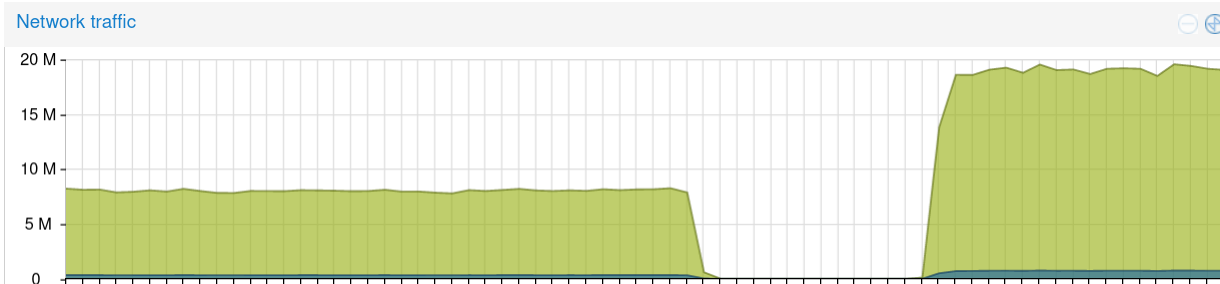
We then launched the load test again with the same parameters, and saw another dramatic improvement. Locust was now able to generate nearly 20M of sustained traffic.
Further optimizations, such as completely replacing Beautiful Soup with regular expressions didn't produce any additional measurable gains.
On the web server, we see that Locust is doing a decent job of simulating load, putting some visible stress on server processes:
However, reviewing our earlier notes, by comparison Goose was able to generate over 35 Mbit/second. And what's even more interesting is that it's doing this while leveraging heavy libraries to parse the HTML and extract links and post comments. These libraries make our job writing load tests easier, but it leads to an obvious question, can we speed up Goose through the same optimizations we made to Locust?
Speeding Up Goose through Optimization
We did two rounds of optimizations on Goose. First, we replaced the Select library with regular expressions optimizing how we extract static assets from the page. Next, we also replaced the Scraper library with regular expressions optimizing how we log in and post comments.
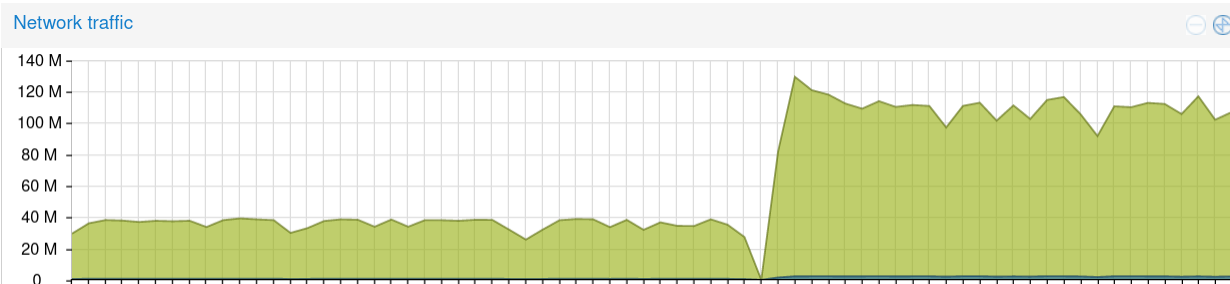
As with Locust, we saw a considerable improvement. Goose was now able to generate 110 Mbit/second of useful network traffic, all from a single VM core!
On the web server, Goose is giving all server processes a truly impressive workout:
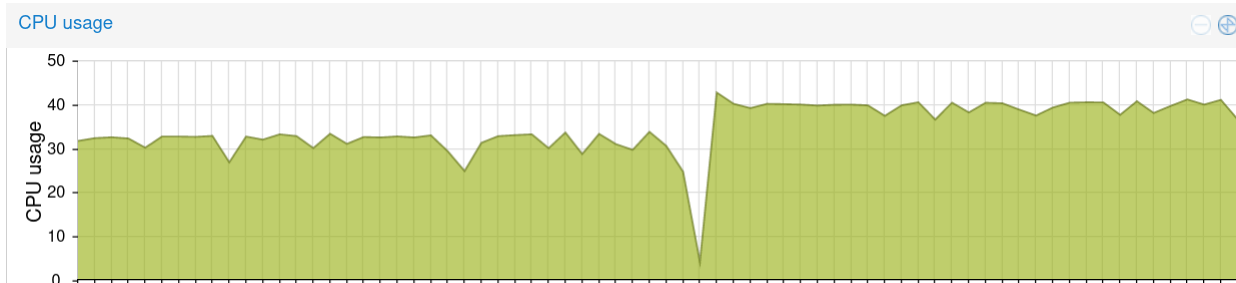
This additional load is consistent:
And Varnish continues to serve most requests out of RAM:
After an hour, Goose displayed the following statistics:
------------------------------------------------------------------------------
 Name                    | # reqs         | # fails        | req/s  | fail/s
 -----------------------------------------------------------------------------
 GET (Auth) node page    | 112,787        | 0 (0%)         | 31     | 0
 GET (Anon) user page    | 416,767        | 0 (0%)         | 115    | 0
 GET (Auth) login        | 3              | 0 (0%)         | 0      | 0
 POST (Auth) login       | 3              | 0 (0%)         | 0      | 0
 GET (Auth) front page   | 169,178        | 0 (0%)         | 46     | 0
 GET static asset        | 13,518,078     | 0 (0%)         | 3,755  | 0
 GET (Auth) comment form | 33,836         | 0 (0%)         | 9      | 0
 GET (Anon) node page    | 1,389,225      | 0 (0%)         | 385    | 0
 GET (Auth) user page    | 33,834         | 0 (0%)         | 9      | 0
 GET (Anon) front page   | 2,083,835      | 0 (0%)         | 578    | 0
 POST (Auth) comment f.. | 33,836         | 0 (0%)         | 9      | 0
 ------------------------+----------------+----------------+--------+---------
 Aggregated              | 17,791,382     | 0 (0%)         | 4,942  | 0
-------------------------------------------------------------------------------
 Name                    | Avg (ms)   | Min        | Max        | Median
 -----------------------------------------------------------------------------
 GET (Auth) node page    | 27         | 10         | 5973       | 30
 GET (Anon) user page    | 5          | 1          | 12196      | 1
 GET (Auth) login        | 8899       | 6398       | 11400      | 9000
 POST (Auth) login       | 64         | 57         | 74         | 60
 GET (Auth) front page   | 22         | 14         | 6029       | 20
 GET static asset        | 0          | 1          | 6030       | 1
 GET (Auth) comment form | 27         | 10         | 5973       | 30
 GET (Anon) node page    | 7          | 1          | 6038       | 1
 GET (Auth) user page    | 13         | 6          | 6014       | 10
 GET (Anon) front page   | 0          | 1          | 6017       | 1
 POST (Auth) comment f.. | 38         | 20         | 265        | 40
 ------------------------+------------+------------+------------+-------------
 Aggregated              | 1          | 1          | 12196      | 1
-------------------------------------------------------------------------------
 Slowest page load within specified percentile of requests (in ms):
 ------------------------------------------------------------------------------
 Name                    | 50%    | 75%    | 98%    | 99%    | 99.9%  | 99.99%
 -----------------------------------------------------------------------------
 GET (Auth) node page    | 30     | 30     | 50     | 50     | 70     |     70
 GET (Anon) user page    | 1      | 10     | 20     | 30     | 40     |     40
 GET (Auth) login        | 9000   | 9000   | 11000  | 11000  | 11000  |  11000
 POST (Auth) login       | 60     | 60     | 70     | 70     | 70     |     70
 GET (Auth) front page   | 20     | 20     | 40     | 40     | 50     |     50
 GET static asset        | 1      | 1      | 4      | 6      | 10     |     10
 GET (Auth) comment form | 30     | 30     | 50     | 50     | 70     |     70
 GET (Anon) node page    | 1      | 3      | 50     | 50     | 70     |     70
 GET (Auth) user page    | 10     | 10     | 20     | 30     | 40     |     40
 GET (Anon) front page   | 1      | 1      | 5      | 7      | 20     |     20
 POST (Auth) comment f.. | 40     | 40     | 60     | 70     | 100    |    100
 ------------------------+--------+--------+--------+--------+--------+-------
 Aggregated              | 1      | 1      | 30     | 30     | 50     |     70
More optimizations are certainly possible. For example, just how Locust offers a FastHttpClient, the Rust ecosystem also has clients faster than Reqwest. And as Goose is written in Rust, adding more cores to the load testing server gives it more power without any additional configuration.
Goose Roadmap
Profiling
While Goose has proven quite capable at generating a lot of load, it's hard to miss the periodic dips visible in the Goose network traffic graphs. Some effort is required to profile the load testing tool under load, to understand what bottlenecks are causing this, and determine if it's fixable. Best case, the generated load should be steady, as is generally seen when load testing with Locust. Hopefully this issue can be fully understood and resolved in a future release.
Beyond that, this is a very early version of Goose, and as such is totally unoptimized. We are confident that with a little time and effort Goose's ability to generate load can be greatly improved.
Automated Testing
Cargo has built-in support for running tests, and Goose would benefit from considerably better test coverage. While there's already quite a few tests written, over time we aim to have nearly complete coverage.
More Examples
As of the 0.5.8 release which was used to write this blog, Goose comes with two example load tests. The first, simple.rs, is a clone of the example currently found on the Locust.io website. It doesn't do much more than demonstrating how to set up a load test, including a simple POST task, and some GET tasks. It is primarily useful to someone familiar with Locust, looking to understand the differences in building a load test in Rust with Goose.
The second example, drupal_loadtest.rs, was previously discussed and is a clone of the load test Tag1 has been using to validate new releases of the Drupal Memcache module. It leverages much more Goose functionality, including weighting task sets and tasks, as well as parsing the pages that are loaded to confirm expected elements exist. Prior to our regular expressin optimization it leveraged the scraper library to extract form elements required to log into a Drupal website and post comments. It also used the select library to extract links from returned HTML in order to load static elements embedded in image tags.
The plan is to add several other useful examples, providing additional recipes on how you might leverage Goose to load test your websites, API endpoints, and more. Contributed examples leveraging different libraries from the Rust ecosystem are very welcome!
API
Currently Goose is controlled entirely through run-time options specified on the command line. The development plan is to expose an API allowing the same functionality to be controlled and monitored in other ways.
Gaggles
The first intended use-case of the Goose API will be to add support for distributed load testing. Two or more Goose instances working together will be referred to as a Gaggle. A Goose Manager instance will be able to control one or more Goose Worker instances. If enabled, Goose Workers will also regularly send statistics data to the Goose Manger instance. We are also exploring the possibility of multi-tiered Gaggles, allowing a single Goose instance to be both a Worker and a Manager, making it possible to group together multiple Gaggles.
Web User Interface
The second intended use-case of the Goose API will be to add a simple UI for controlling and monitoring load tests from a web browser. As with everything else in Goose, the initial goal of this UI will be to clone the functionality currently provided in the Locust UI. Once that is working, we will consider additional functionality.
The web user interface will live in its own Cargo library for a couple of reasons. First, if you don't need the UI, you won't have to install it and its dependencies. Second, we hope eventually alternative UIs will be contributed by the open source community!
Async
Currently Goose uses Reqwest's blocking HTTP Client to load web pages. The Reqwest documentation explains:
"The blocking Client will block the current thread to execute, instead of returning futures that need to be executed on a runtime."
With each Goose client running in its own thread, blocking is likely the best simulation of a real user when building load tests. That said, as of Rust 1.39 which was released in November of 2018, Rust gained async-await syntax. We intend to explore adding support for Reqwest's default async-based Client as an optional alternative, as well as adding support for defining tasks themselves to be async. This should allow individual Goose client threads to generate much more network traffic.
Multiple HTTP Clients
Related, we will also explore supporting completely different HTTP clients. There's nothing in Goose's design that requires it to work only with Reqwest. Different clients will have different performance characteristics, and may provide functionality required to load test your project.
The current intent is to keep Reqwest's blocking HTTP client as the default, and to make other clients available as compile-time Cargo features. If another client library proves to be more flexible or performant, it may ultimately become the default.
Macros
One of our favorite features of Locust is how easy it is to write load plans, partially thanks to their use of Python decorators. We hope to similarly simplify the creation of Goose load plans by adding macros, simplifying everything between initializing and executing the GooseState when writing a load plan. Our goal is that writing a load plan for Goose essentially be as simple as defining the individual tasks in pure Rust, and tagging them with one or more macros.
Summary
Though Goose is still in an early stage of development, it is already proving to be very powerful and useful. We're actively using it to prepare the next release of the Drupal Memcache module, ensuring there won't be unexpected performance regressions as mission critical websites upgrade to the latest release. We're also excited to leverage the correctness, performance, and flexibility provided by Rust and its ecosystem with future client load tests.
To get started using Goose in your own load testing, check out the comprehensive documentation. The tool is released as open source, contributions are welcome!