

Continuing with our MongoDB monitoring series, today we are releasing Cacti Performance Graphing templates and unit tested data sources for MongoDB. These are built on top of Baron Schwartz's excellent Cacti Graph framework found here (http://code.google.com/p/mysql-cacti-templates). This framework allows you to define graphs via a simple (relatively) perl file and to create testable data sources for your graphs. I highly recommend it.
MongoDB Cacti
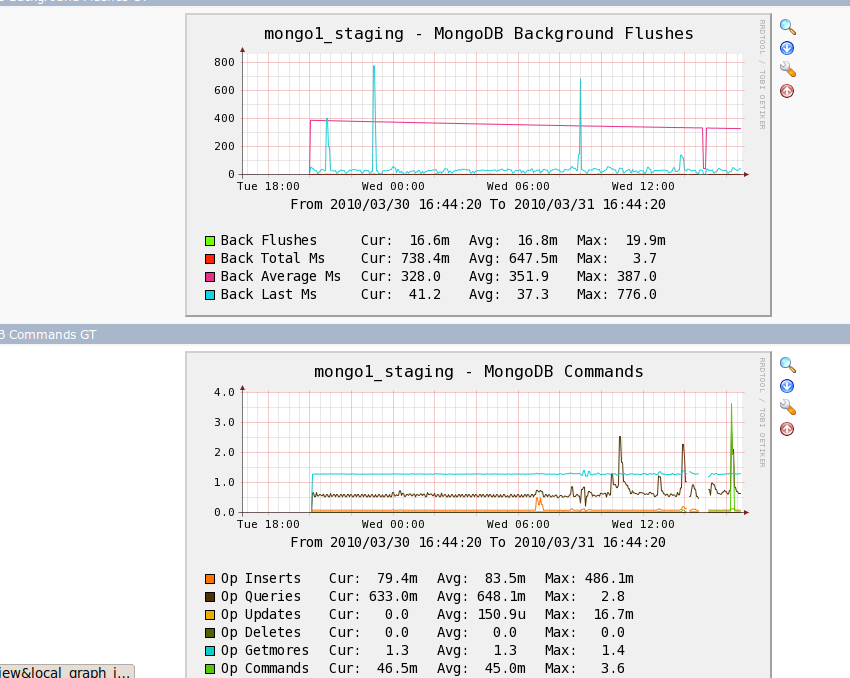
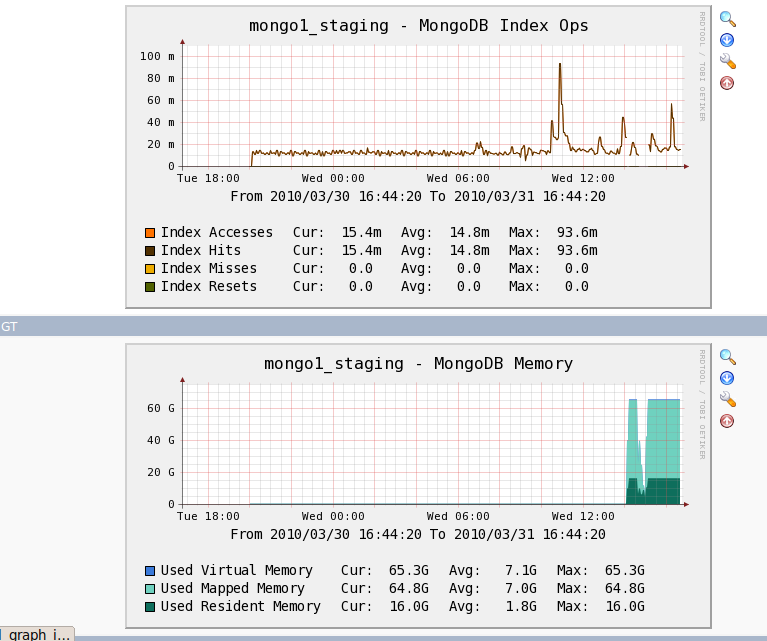
These Cacti Graphs, Data Templates and Data Sources allow Cacti to ssh into a remote MongoDB server and create historical graphs from the output of the serverStatus admin command. Using this data, we can graph:
- Background Flushes
- Index Operations
- Commands
- Connections
- Memory Usage
- Slave Lag
Some example screenshots can be seen below:
Getting The Graphs
These graphs have been submitted upstream to the MySQL Cacti Templates Project (http://code.google.com/p/mysql-cacti-templates/). If they are included, they will be available from that project and I will cease maintaining them here.
For now, they are available from our internal git repository.
Web: http://tag1consulting.com/cgi-bin/gitweb.cgi?p=cacti-mongo.git;a=summary
Git: git://tag1consulting.com/cacti-mongo.git
The entire framework from the mysql-cacti-templates project is included here. To create the graphs, run make.sh. You can then follow the documentation included or just copy the ss_get_by_ssh script to your scripts dir in Cacti and then import the mongodb XML template file created when you run make.sh.
Note you will need to edit the top of ss_get_by_ssh, customizing the location of your ssh key and the ssh user name. Also note that the ENTIRE framework is in the git repository, including other graphs supported by the project. These other graphs will not be updated in this git repo, I suggest fetching them from the upstream project itself and not including them in your Cacti installation from THIS copy of the framework. Please only use the MongoDB graphs from this git repository.
This work was sponsored by Examiner/ClarityDG and we thank them for their support.
Need a Hero to Monitor All Those Drupal Security Modules?
Tag1 Quo saves the day, offering a single dashboard that monitors all your Drupal sites.